What does Ryanair's recent profit slump tell us about the state of the aviation market in Europe?
Pre-tax profits fall by 46% at Ryanair in Q2
We’ve had a string of results announcements recently from the European airlines. The most shocking of these came from Ryanair on the 22nd July, with pre-tax profits slumping by almost half compared to the previous year. That was driven by a 15% fall in average fares, with the company blaming “the pricing environment”, a situation which is says it expects to continue into the remainder of the summer season, with prices “materially lower than last year”.
Although Ryanair’s share price took a hammering, falling 15% on the day, investors took the news as evidence of weaker market demand, rather than a Ryanair specific issue. That’s understandable because Ryanair offered no explanations other than the timing of Easter and market conditions. You can see from the chart below that although Ryanair’s share price suffered the most damage, Wizz, easyJet and even more long-haul focused IAG also saw their share prices take a hit on the day.
Source: Yahoo Finance, GridPoint analysis
Like many other industry analysts, I was really surprised by how bad the Ryanair results were. I decided not to post anything until I’d seen the figures from Ryanair’s competitors, to see if they confirmed the same trend.
Next to report was easyJet on July 24th, followed by both Wizz and IAG on August 1st. What did their unit revenue performance show?
Unit revenue comparison
Before I show the comparative figures for unit revenue, I should point out that by focusing on a 15% fall in average fares, Ryanair made the unit revenue performance look particularly bad. That metric excludes ancillary revenue, which now represents over 35% of revenues at Ryanair. Ancillary revenues were essentially flat on a per passenger basis, bringing the overall reduction in revenue per seat to “only” 10%.
But that was still much, much worse than the figures reported by any of its main competitors. The closest comparator, Wizz, saw unit revenues rise by 1% and easyJet did even better with a 6% increase. For IAG, I’ve used the figures for its low-cost unit Vueling, which saw revenue per seat fall by 4%. Especially given the shift in the timing of Easter, none of the other three airline results fit with Ryanair’s rhetoric about a weak pricing environment in Q2.
Source: Company reports, GridPoint analysis
What about Q3?
Ryanair said that the September quarter (calendar Q3 and their fiscal Q2) would see prices “materially lower” than the prior year. But in their outlook statements, none of the other airlines told the same story.
In its comments, easyJet predicted another “record-breaking summer” and said that 69% of seats were already sold for the September quarter, 1 point up on the same time last year, with total yield (revenue per passenger) broadly flat versus the prior year. Wizz said that “We remain optimistic about the demand outlook, with both ticket and ancillary RASK expected to be up year-on-year”. RASK (revenue per ASK) is pretty much the same thing as revenue per seat, as long as stage length remains stable. IAG said that the outlook for the summer remained strong.
Share price reactions to the results announcements
In the chart below, I’ve shown the share price reactions to the various company results announcements. We’ve already seen that Ryanair’s shares fell by 15% on the day. When easyJet reported much better unit revenues two days later, their share responded positively (up 3%) and continued to trade up over the next couple of days, just about recovering to the levels seen before the Ryanair announcement. But investors didn’t seem to read across the better easyJet results into their view on Wizz or IAG. In fact, when Wizz announced their results on the 1st August, their shares took an even bigger hit, falling by another 23%, leaving the shares down almost 35% compared to the middle of July. As we’ve seen, the revenue results were quite decent and certainly much better than Ryanair’s. The Wizz share price drop was probably driven by poor unit cost performance, with non-fuel cost per ASK (CASK), up 8% on the prior year. It is hard to disentangle what drove the share price response to the IAG results announcement (down 3%), since on the same day the company also announced the termination of their attempt to take over Air Europa and the resumption of the dividend.
Source: Yahoo Finance, GridPoint analysis
The main thing that strikes me is that Ryanair’s unit revenue issues seem to have been taken as a comment on the state of the market in general, even after quite strong evidence that this is a Ryanair specific issue. On the other hand, good unit revenue performance by easyJet appears to have been taken as specific to them. Ironically the only other airline shares that seem to have benefited from easyJet’s results were those of Ryanair. It all seems quite illogical to me.
What is going on at Ryanair?
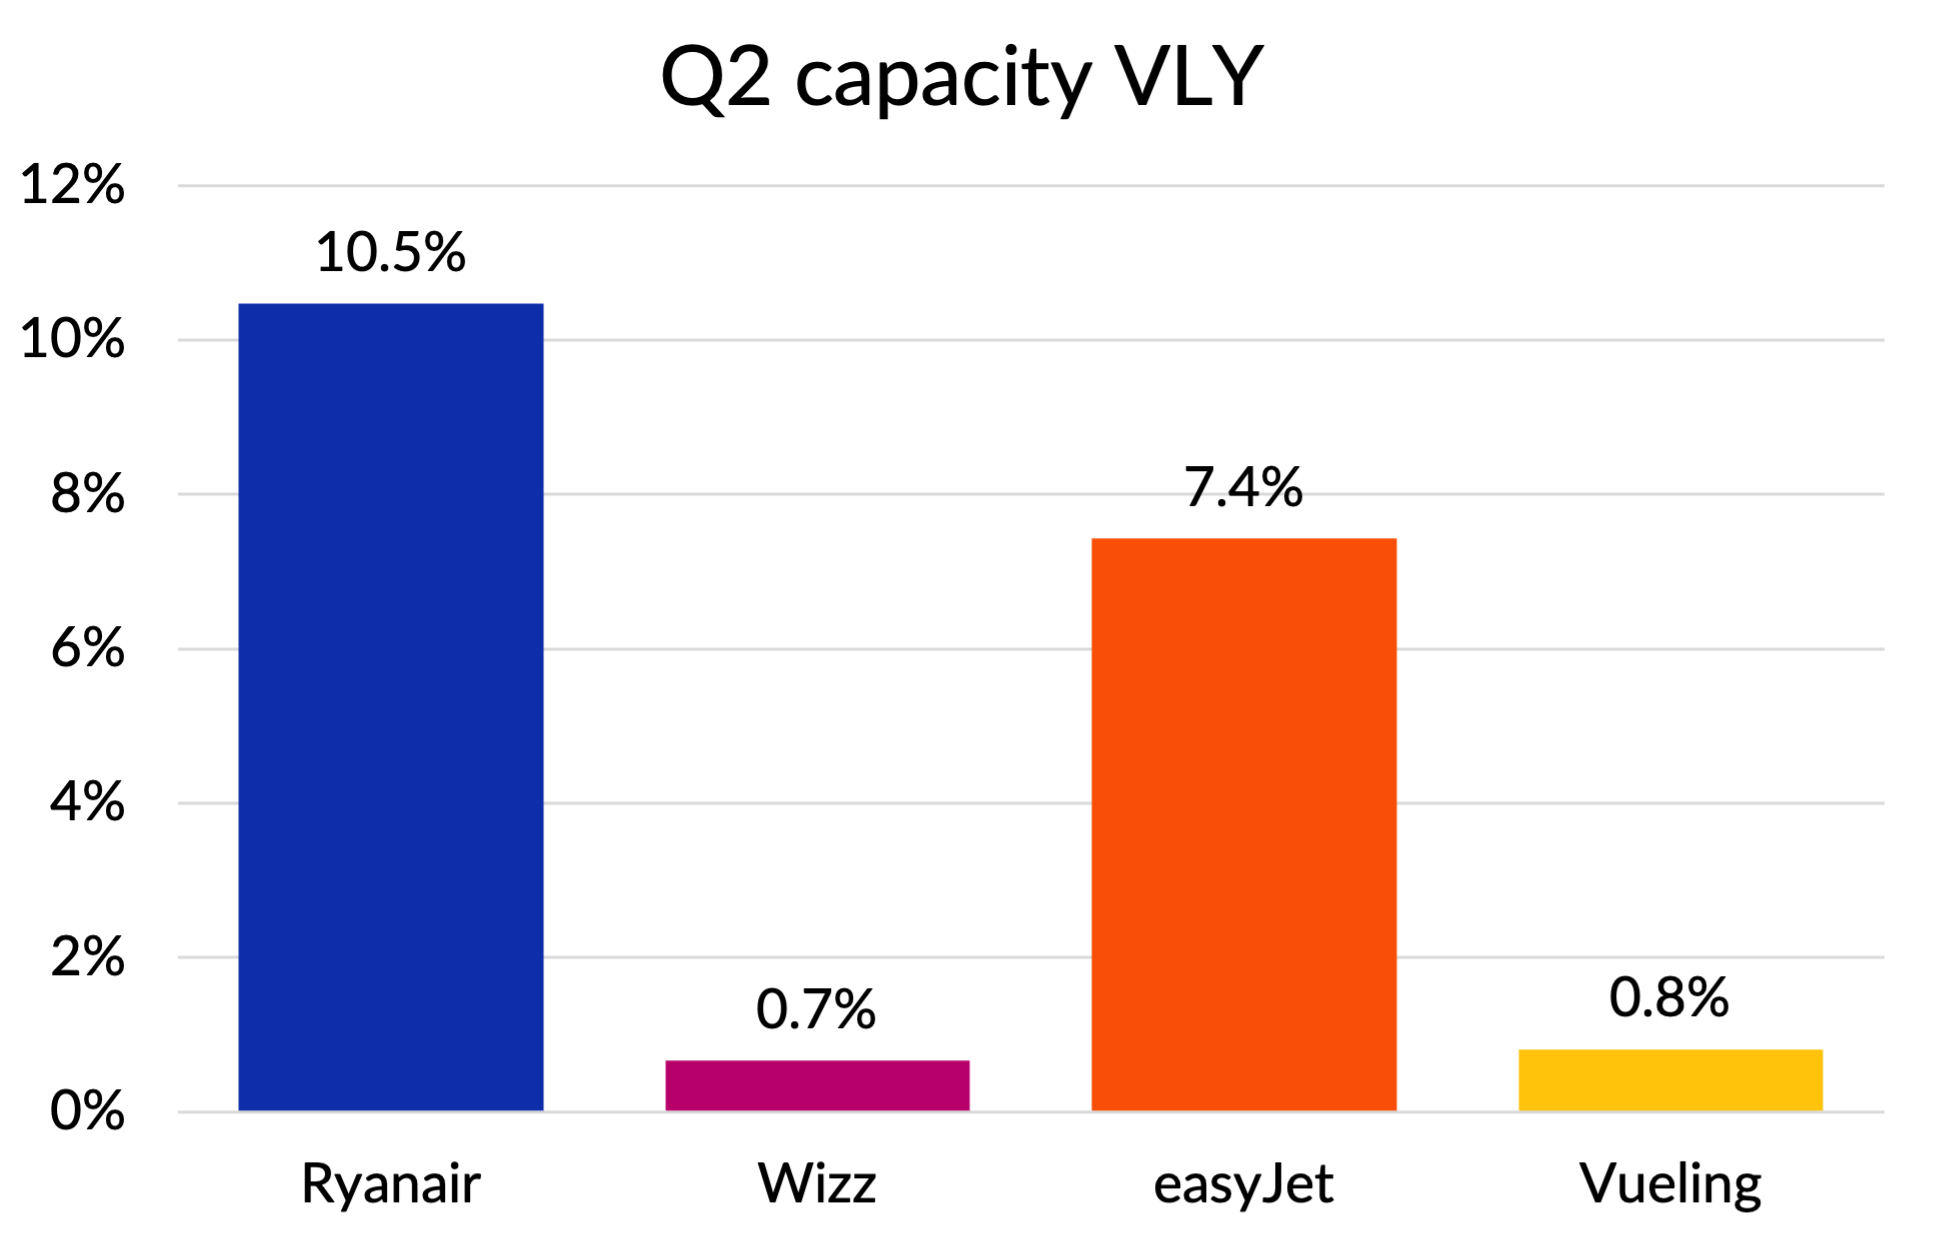
If Ryanair’s pricing issues are not driven by the general market environment, what is going on? Undoubtedly, part of the issue is capacity growth. On the following chart, you can see that despite delays in Boeing deliveries, Ryanair was the fastest growing of all these carriers in the quarter. Wizz’s growth was held back by the Pratt & Witney engine issues that are affecting many operators, including Vueling. But Ryanair’s growth wasn’t much higher than easyJet’s, who delivered massively better unit revenue performance. Ryanair could have messaged that their unit revenues were under pressure because of their fast growth, but that doesn’t fit with the story they want to tell.
Source: Company reports, GridPoint analysis
I tried to see if there was any evidence of revenue issues in specific markets for Ryanair. We don’t get much information from them about geographical performance, but they do report revenues for their biggest markets, which allows me to do the following chart, showing unit revenue growth compared to capacity growth. As you’d expect, unit revenue trends were a bit weaker in higher growth markets, but this analysis seems to say the underperformance affected Ryanair’s whole network, rather than being something market specific.
Source: Company reports, published schedule data, GridPoint analysis
Are Ryanair deliberately depressing prices and price expectations?
The company’s public line is that their strategy is to grow capacity faster than the market and then let the price be whatever it needs to be to fill the planes. As the lowest cost operator, they are confident that even if they are not making money, their competitors will be losing more and will eventually be forced to pull back and make room for them.
There is much logic in this. But it is possible that they are going further and deliberately pricing below the levels needed to fill their planes. I’ve heard anecdotal evidence that they are “selling out” some way before departure. If that is true, they are sub-optimising their revenue. That could just be evidence of poor revenue management. These days, it would be tempting to wonder whether they’ve rolled out a new AI-powered pricing algorithm and the system hasn’t worked properly. But it could also be a deliberate strategy to depress competitor revenues and hasten retrenchment decisions. With a much stronger balance sheet than their competitors, that is game they can easily afford to play.
It is even possible that Ryanair’s commentary about downward pressure on next quarter’s prices is exaggerated. They left themselves the “out” that results would be “totally dependent on close-in bookings and yields in Aug. and Sept”. I’ve always believed that Ryanair likes to talk down the market, generating media stories about price wars which play to their positioning as the lowest cost operator and put pressure on competitor airlines to take a cautious approach on capacity.
Are they doing that here? Only time will tell. But I’d certainly advise airline decision makers and analysts to consider the possibility before jumping to conclusions about the state of the market based on Ryanair’s statements.


