
Stonking full year results from IAG
Profit growth resumes in the second half
Last Friday, IAG released full year results for 2024. After a period where the post-pandemic profit recovery seemed to stall, profit growth took off again in the second half of the year.

Source: Company reports, GridPoint analysis
That was mainly down to the group’s largest airline, British Airways, finally getting its profit engine restarted, although strong performance at Vueling also played a part. Business travel remains down on pre-pandemic levels, especially for short trips. However, the corporate travel that is so important to BA’s economics finally seems to have taken off again at the end of the year.
Source: Company reports, GridPoint analysis
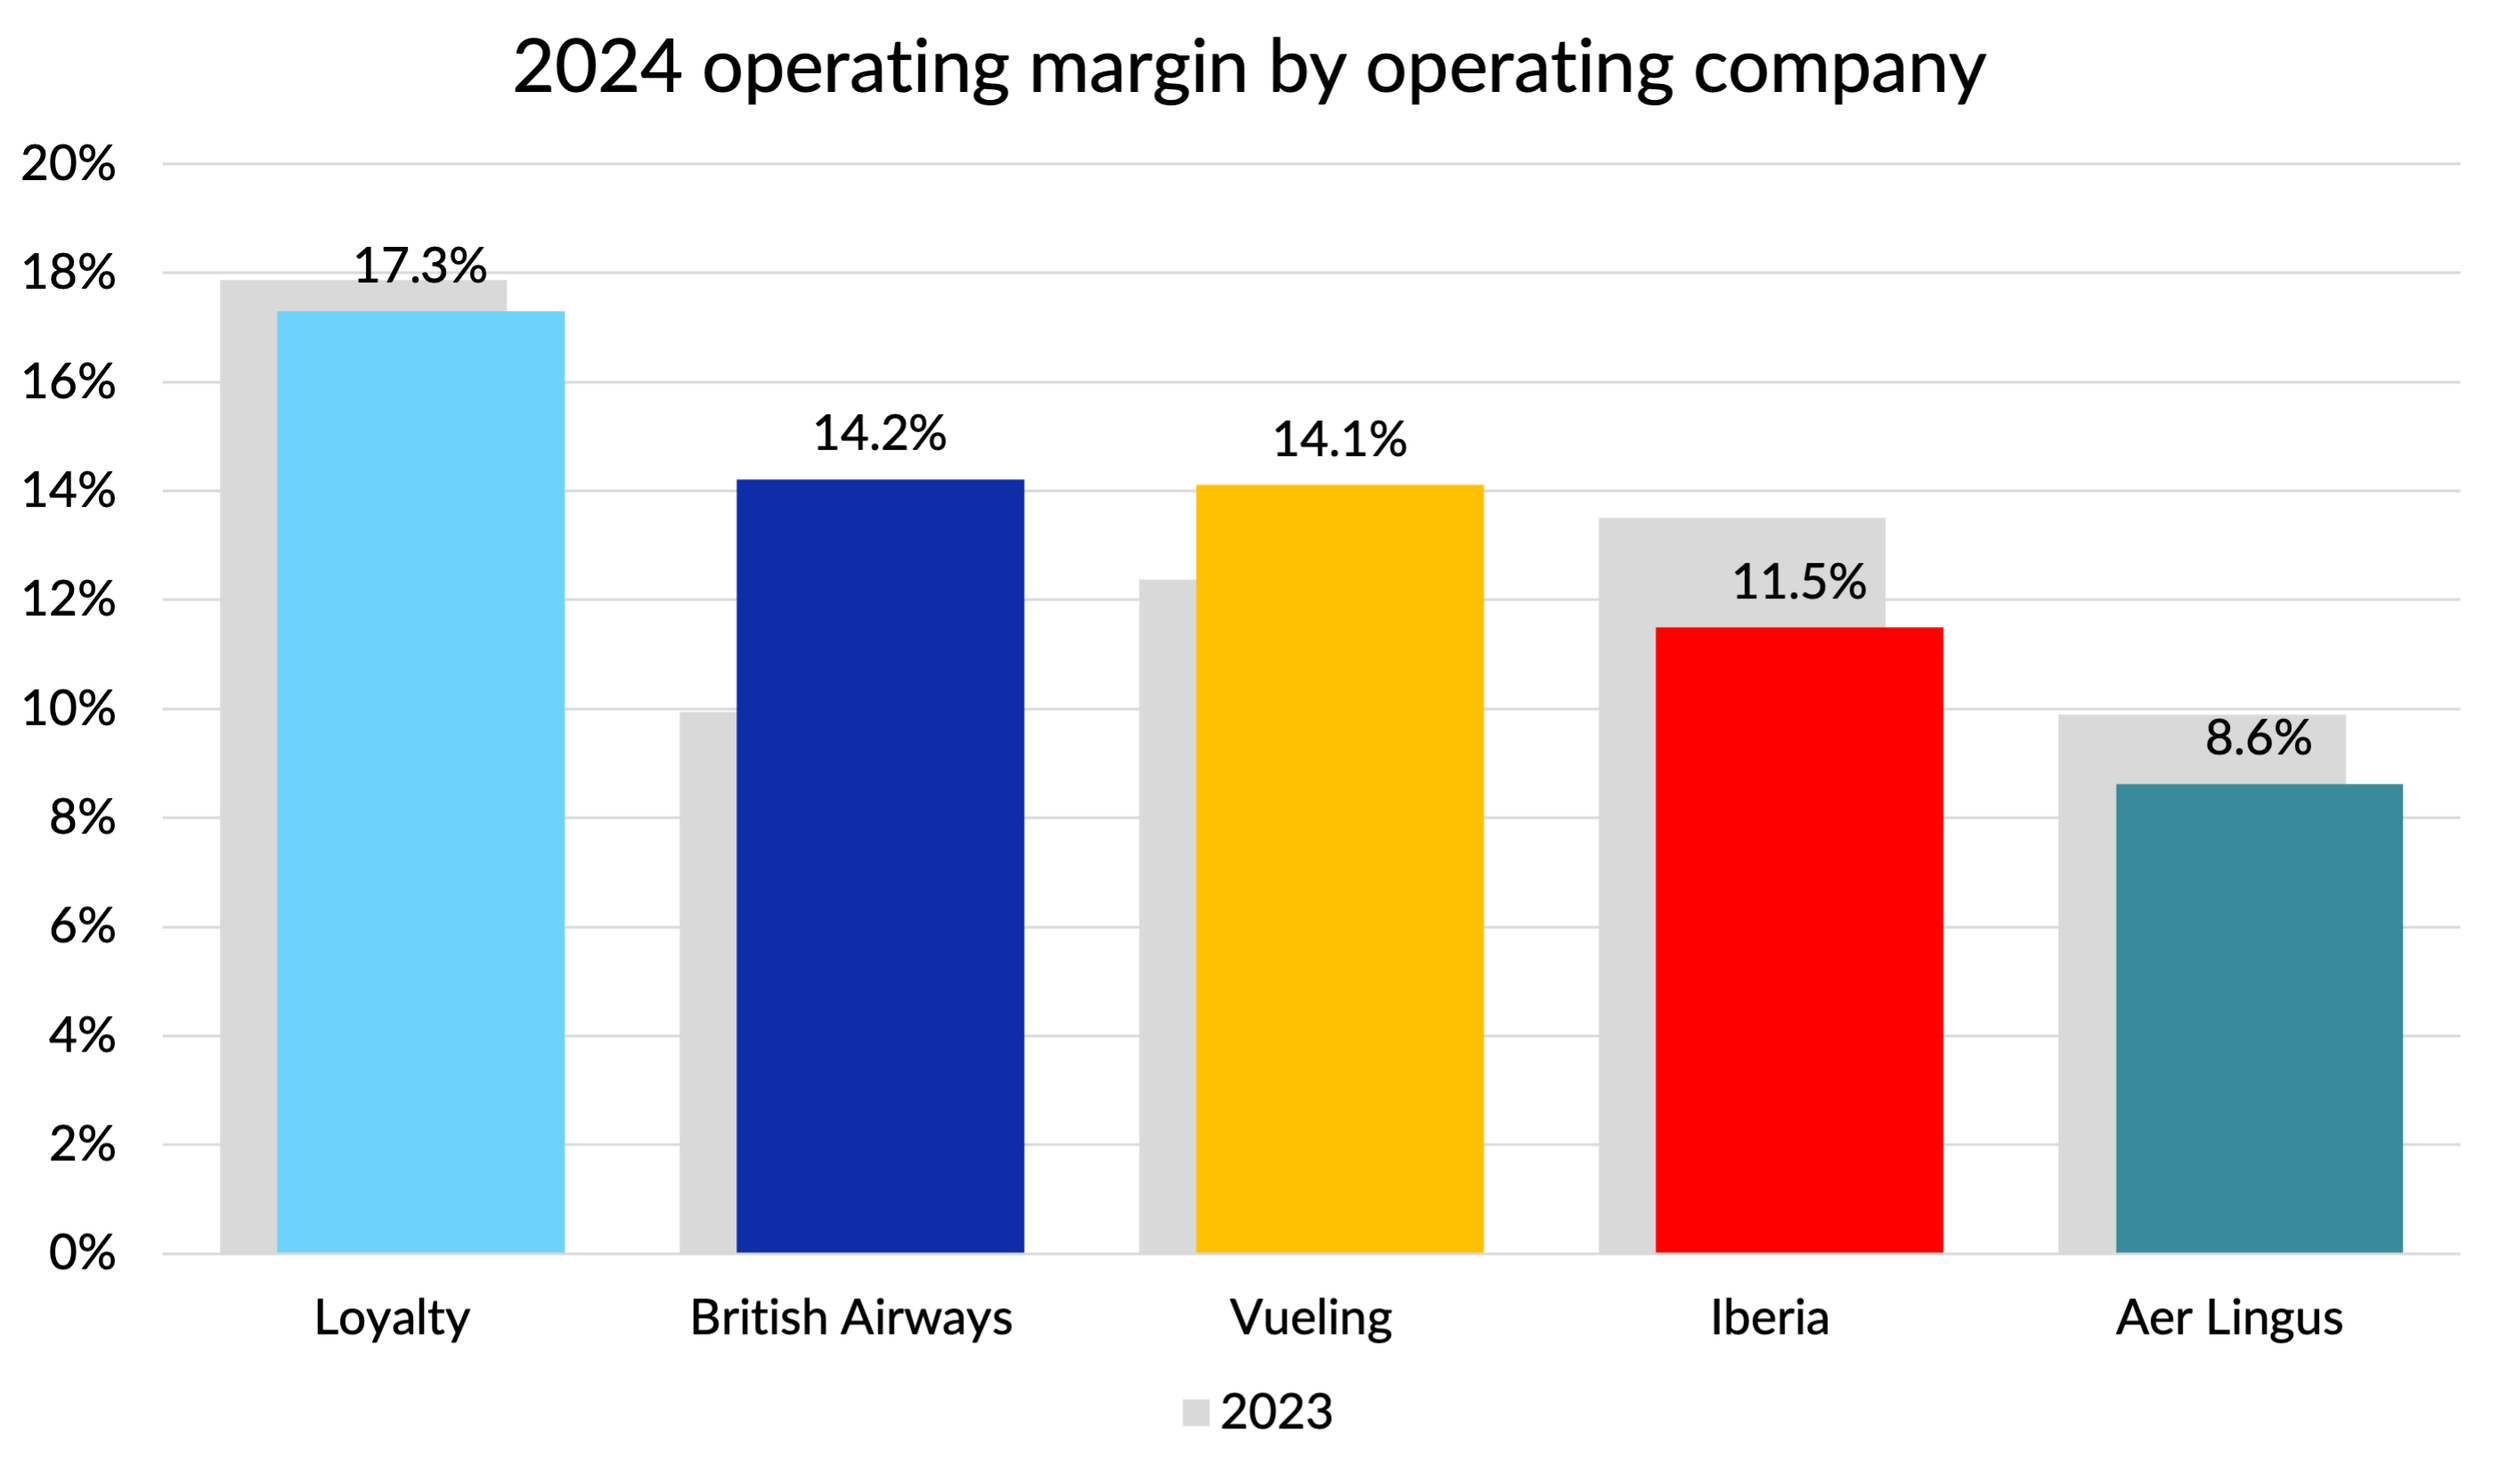
New records for profitability
The overall group operating margin of 13.8% was a new record for IAG, beating the 13.3% set back in 2018. The pre-tax margin of 11.8% wasn’t quite a record, that was outdone in 2018 when 12.5% was achieved. Additional debt taken on during the pandemic has still not been fully paid down.
IAG’s margins also handily beat most other airline comparators. We’ll have to wait until all the results are in to see where they ranked, but operating margin beat Ryanair (12.3%), Delta (10.6%) and United (8.9%). IAG’s European network rivals Air France - KLM and Lufthansa Group will report tomorrow and will undoubtedly fall far short of the benchmark that IAG has set.
In absolute terms, operating profits of £4.4 billion and pre-tax profits of £3.8 billion both set new records for IAG. But high inflation in recent years flatters those metrics compared to figures set five years ago. Nevertheless, even adjusting for inflation, operating profits were 10% higher than 2019 and pre-tax profits were 4% up.
So “stonking” is a decent summary I think.
Although I've said that we should all stop looking back at 2019 as a reference, I’m going to do it one more time in this instance. Given that IAG has finally beaten the profit benchmarks set back then, I thought it would be interesting to look at what has changed.
Changes in activity since 2019
In terms of activity levels, IAG overall in 2024 was remarkably close to IAG in 2019 on most volume drivers. Stage length was a little longer, but very similar.

Source: Company reports, GridPoint analysis
Given how similar the volume metrics are and the fact that comparisons at a group level are by nature broad brush, I’m mostly not going to use unit metrics or adjust for stage length in the analysis which follows. I decided to keep things simple and just look at how the raw figures had changed. However, there has been a lot of inflation since 2019, so I did look at things on an inflation adjusted basis.
Revenue performance
Some of the profitability improvement since 2019 is driven by revenue performance outpacing inflation. The star of the show is “other revenue”, with big ancillary revenue improvements at Vueling and strong performance at IAG Loyalty and BA Holidays being two of the drivers in that category. Cargo revenue spiked during COVID, but has fallen away again. The overall reduction in cargo revenue is I am sure linked to the Asian network still not being back to pre-pandemic levels.

Source: Company reports, GridPoint analysis
Cost trends
Operating costs have also grown slightly faster than inflation (1.3%), but by a little less than we saw with revenue (2.4%). The following chart shows the inflation adjusted increase by cost category, sorted by the size of the cost in 2024.

Source: Company reports, GridPoint analysis
Some things are reasonably easy to understand. The fact that depreciation costs have not risen in line with inflation makes perfect sense. Historical cost accounting for long-lived assets like aircraft will tend to flatter profits in a high inflation environment. The group also took something of a capital expenditure holiday during the pandemic and that will have had a benefit in depreciation costs. This may also have led to the higher maintenance costs, but I think that likely has more to do with supply chain and engine reliability problems.
Lower selling costs rather stand out as a success story, with continued changes to distribution undoubtedly playing a part (although with an offset in higher IT costs). Also important I’d think will be the shift towards leisure traffic, which typically has much lower cost of sale than business travel.
One of the areas that puzzled me was the apparently large reduction in “landing fees and navigation charges”, so I thought I’d take a closer look at that one.
Landing fees and navigation charges
IAG’s biggest bill for airport charges will come from Heathrow, maybe accounting for around 30% of IAG’s costs in this expense line.
The headline charge at Heathrow in 2019 was £22.913 per passenger and that had increased to £26.777 in 2024, a 16.9% increase, 6% below UK inflation over the period. In my cost chart above, I looked at things in euros and adjusted for euro area inflation. Euro inflation was a bit below sterling inflation and the pound strengthened, so on that basis, Heathrow charges were essentially flat over the period.
But things aren’t that simple. Like most network airlines, IAG accounts for the “per passenger” element of airport charges as a deduction to revenue, with the (rather feeble) logic that, like a government tax, they are collecting it from passengers on behalf of someone else and it should therefore appear in neither revenues nor costs. In any event, only the element of the charges that is levied on a movement or other “non-passenger basis” will end up in this cost line.
Back in 2019, 36% of Heathrow’s airport charges were recovered on that basis, but by 2024 that had increased to 43%. By itself, this should have led to a 13% uplift to reported landing fees. The counter part of course would have been to provide a boost to reported revenue. Based on figures published each year by Heathrow when it sets the charges, income from non-passenger fees for 2024 was forecast to be 32% higher than in 2019. Even after adjusting for inflation, that’s still a big increase, which doesn’t seem very consistent with the high-level cost trend we just saw.
There are many other moving parts where LHR charges are concerned. Relative performance on noise, NOX and CO2 emissions and SAF uplift are all important. I’ve spent far too long trying to work out whether those factors could explain the mismatch and although there are some pluses and minuses, if anything considering those effects seemed to increase the discrepancy rather than explain it.
So it must be that increases at Heathrow have been more than compensated for by charges elsewhere going up by less than inflation. I think that was true for Eurocontrol charges and for landing fees in Spain. There was almost certainly a big route mix effect too. The cost of overflying Russia was notoriously expensive for European airlines and that cost has disappeared.
Employee costs
IAG’s employee costs have risen 1.6% faster than inflation since 2019. Is that a good performance or a bad one compared to other airlines?
Not everyone has released 2024 results yet, but I did a quick comparison of unit labour cost changes for some of the key competitors who have (next chart). American Airlines has had the lowest increase, but they were coming from quite a bad place in terms of cost competitiveness in 2019. Ryanair has also had very low increases, but they achieved that with the benefit of a 55% increase in capacity and a shift towards lower-cost Eastern European markets. Compared to United and Delta, IAG looks pretty good. It will be interesting to compare the performance of the other European majors when they release their results.

Source: Company reports, GridPoint analysis
I did look at the composition of IAG’s employee numbers and how that had changed. Overall, the headcount has hardly budged (see next chart). The same is true of many of the key operational staff categories - pilot numbers are up 4%, cabin crew are down 5%, maintenance staff are down 4%. Airport staff number reductions of 15% may be linked to automation or other productivity improvements, outsourcing or changes in third party handling activity at Iberia. The 38% increase in corporate headcount is more difficult to explain. It is hard to imagine what an extra 4,500 people could be doing, so perhaps some of it might be a change in definitions? Answers on a postcard please.

Source: Company reports, GridPoint Analysis
In summary
Overall, the IAG results were really good and proved wrong some analysts who thought that BA would never regain it’s pre-pandemic profitability.
I’m sure there is much more I could say, but since we will have full year results from both Air France - KLM and Lufthansa group tomorrow, I think I’ll leave it there for now.